Ankalytik helps you find what matters in the vast amount of data produced by today’s smart systems.
Collect
Store
Organize
Analyze
Visualize
Report
Export
Distribute
Embed
Install
Collect
Get your Data
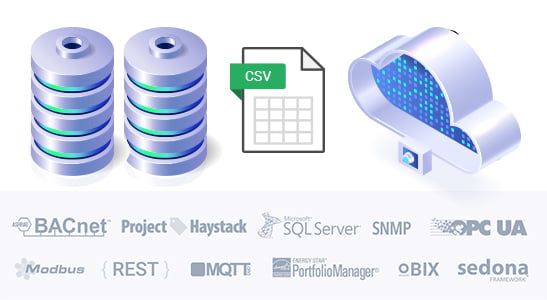
Ankalytik works with data of all types — whether via a live link to an automation system or smart meter, connection to a SQL database, import of historical data from Excel files, or a web service feed from an utility.
Store
High-Performance Database
At the heart of Ankalytik is the high-performance Folio database – specially designed for IoT data. Folio combines the speed of an industrial historian with the modeling capabilities of document and graph databases to store and organize heterogeneous data, creating unified models of your buildings, equipment, devices, and sensors.
Folio’s process historian uses advanced compression to efficiently store billions of time-series records in a fraction of the disk space compared to other technologies. Store live sensor data with microsecond access times.
Ankalytik’s advanced data compression and world-class performance can drastically reduce your hardware server requirements.


Organize
Give your Data Meaning
Ankalytik uses the industry-standard Project Haystack for semantic tagging of data. With proper tagging, analytics applications can quickly consume data from equipment systems and interpret patterns in operational data to identify faults, deviations, and trends that can be addressed to improve efficiency and ensure proper operation of equipment systems.
Analyze
Turn Data into Actionable Intelligence
Access to the data is just the first step. The new challenge is to effectively manage and derive value from the exploding amount of data available from smart and connected devices.
Our solution is Axon — an analytic engine that automatically processes rules and algorithms on your data to find Sparks — things that matter.
Ankalytik then automatically generates visualizations, notifications, and reports that show the issue, time of occurrence, frequency, duration, and even cost.

Visualize
Apps to Help You Find What Matters
Ankalytik includes a rich set of applications to visualize your data and analytic results. All of these intuitive presentations are displayed in standard web browsers using HTML5 technology – no plug-ins required. Ankalytik can also output analytic results to 3rd Party applications via our open published APIs.
While the Ankalytik Axon engine continuously applies analytics to your data, the real value comes when those results are presented to you via Ankalytik Apps – rich visual presentations that show how your systems are really performing.
Ankalytik App
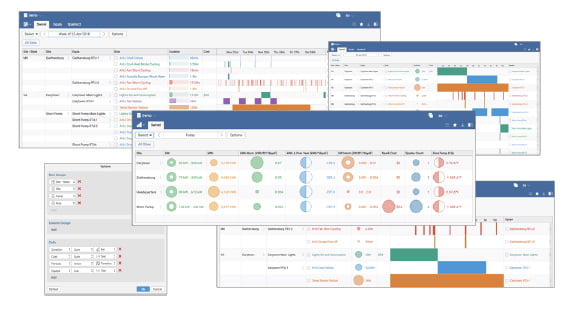
Show analytic results as timelines, bubbles, charts and tabular displays indicating timing, duration, frequency, and cost of issues.
KPI App
Automatically calculate key performance indicators and present as “candle charts” for easy comparison.
Energy App
A comprehensive suite for analysis of energy resources including electrical demand, consumption, cost, water and gas usage.
Historian App
Combine all types of data together along with analytic results to create views to meet specific needs.
Weather App
Read local forecasts and historical weather data and apply to rules and sparks to help evaluate equipment performance.
Rule App
Create custom rules for triggering sparks to identify issues, faults, deviations, and anomalies.
Report & Export
Apps to help you Find What Matters
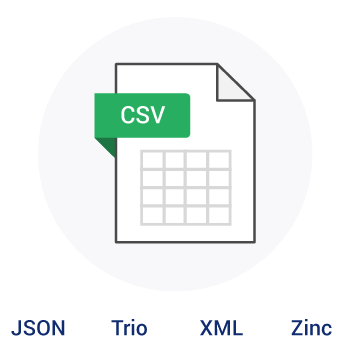
Any Ankalytik view can be turned into a report in a variety of formats, including PDF. Or export the view for use in your favorite desktop word processing or publishing tool in formats including SVG, PNG, Excel and more.



Customize
Build your Own Views
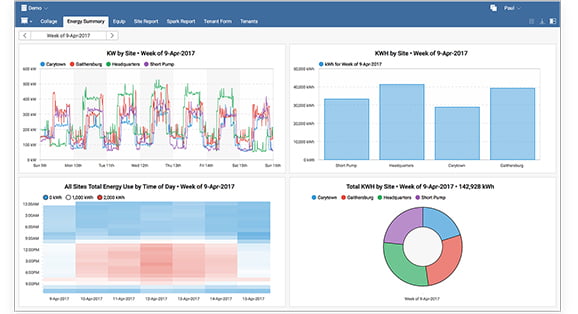
SkySpark’s View Builder combines all the benefits of automatically generated analytics with the ability to create your own customized views quickly and easily.
View Builder provides an extensive library of display widgets and a simple point-and-click tool for creating custom views. Combine graphs, charts, tables, text, selection menus, data entry forms, and more.

Distributed
Ankalytik® Anywhere Deploy from the Edge to the Cloud
Grow Ankalytik to meet any size project. Ankalytik nodes can be clustered together using a protocol we call Arcbeam. Clusters allow Ankalytik nodes to act as a single, seamless, unified system. The distributed architecture can span low cost edge devices, local servers, or the cloud. Arcbeam is designed to work well with your IT infrastructure. We use public/private key pairs for security, and our protocol is firewall friendly.
Embeddable
Run Ankalytik at the Edge
Ankalytik’s full feature set has been designed to run efficiently on small, low-cost IoT platforms that can be deployed at the edge. Work with one of our existing OEMs to buy hardware solutions already bundled with Ankalytik, or build your own devices. Ankalytik runs on any machine that supports a Java VM.
Minimum Tech Specs
For up to 100 points







SOCIAL MEDIA